Rain-Recharge Radar
All 60 Guwahati wards, scored for groundwater recharge potential — before a single borehole is drilled, from open satellite data alone.
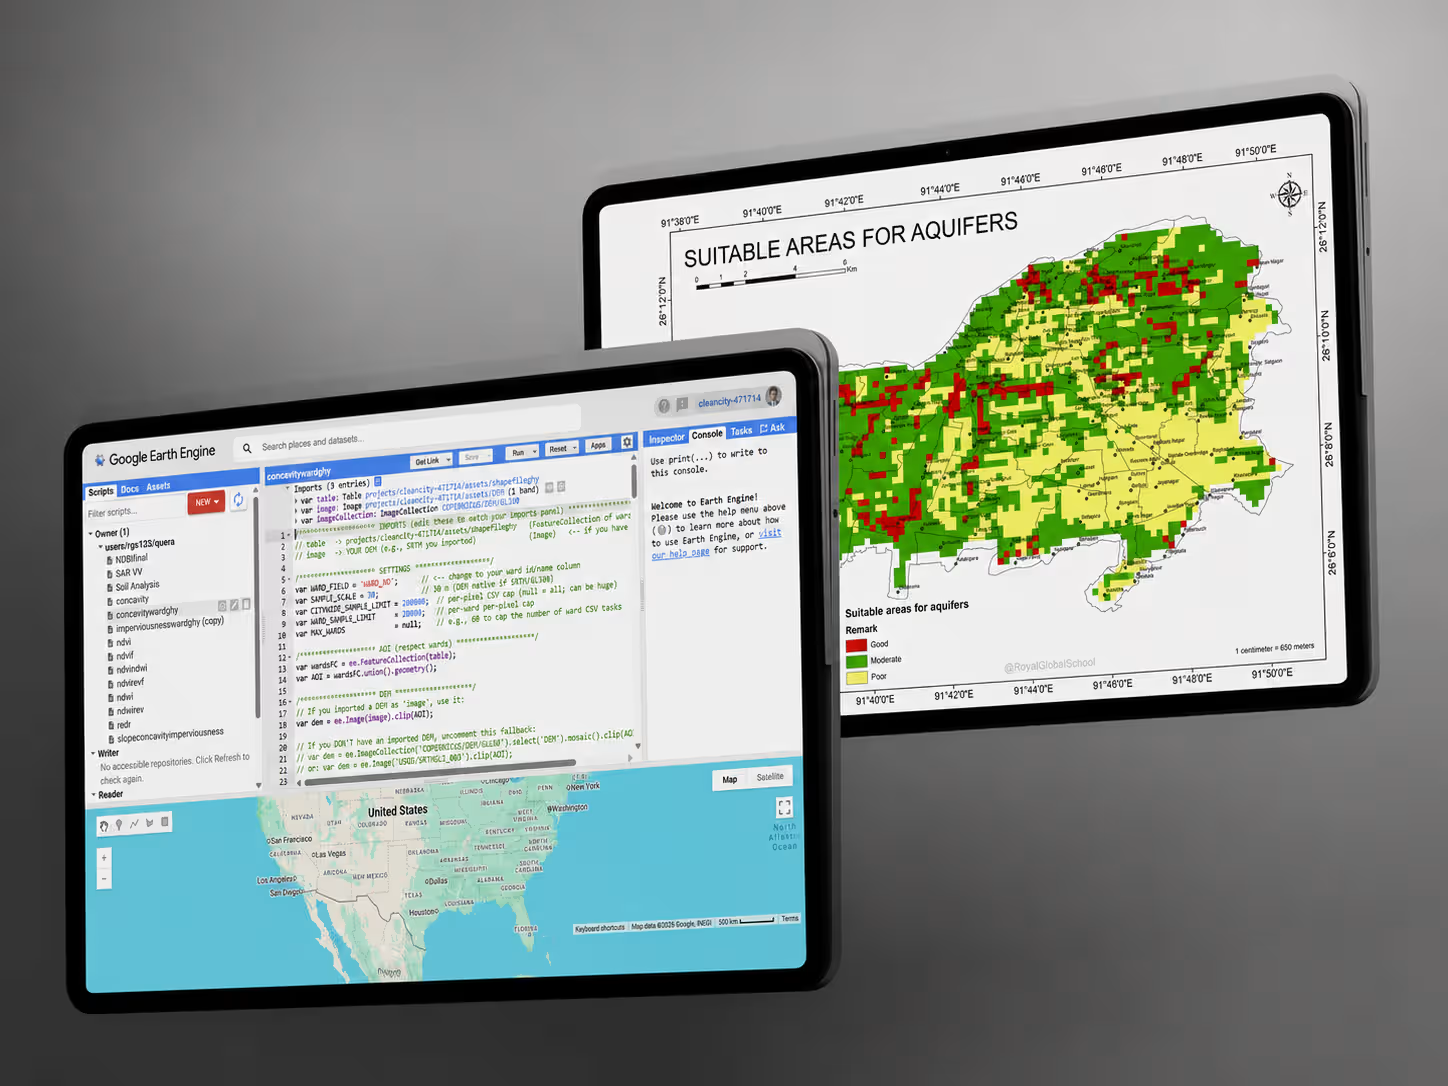
The HydroScore ward map — all 60 GMC wards shaded by recharge favourability, high-scoring wards standing out against the city outline. One screen that ranks the whole city.
Focus
Groundwater recharge screening & stormwater re-use
Coverage
60 GMC wards · ~172.5 km²
Method
Satellite remote sensing + open-source GIS
Rain-RechargeRadarisasatellite-derivedscreeninglayerthatmapswheresurfaceconditionsacrossGuwahatifavourgroundwaterrecharge—reframingmonsoonstormwaterfromaflood-disposalproblemintoanaquifer-storageopportunity.
It fuses radar backscatter, optical indices, terrain, and soil texture into a single ward-level score — built entirely from open satellite data and reproducible GIS, with every layer traceable.
The Problem
Intense monsoons. But stressed aquifers — and deciding where to store the water is still guesswork.
Guwahati floods almost every monsoon, yet its groundwater keeps declining. We mapped the friction points holding back every recharge decision.
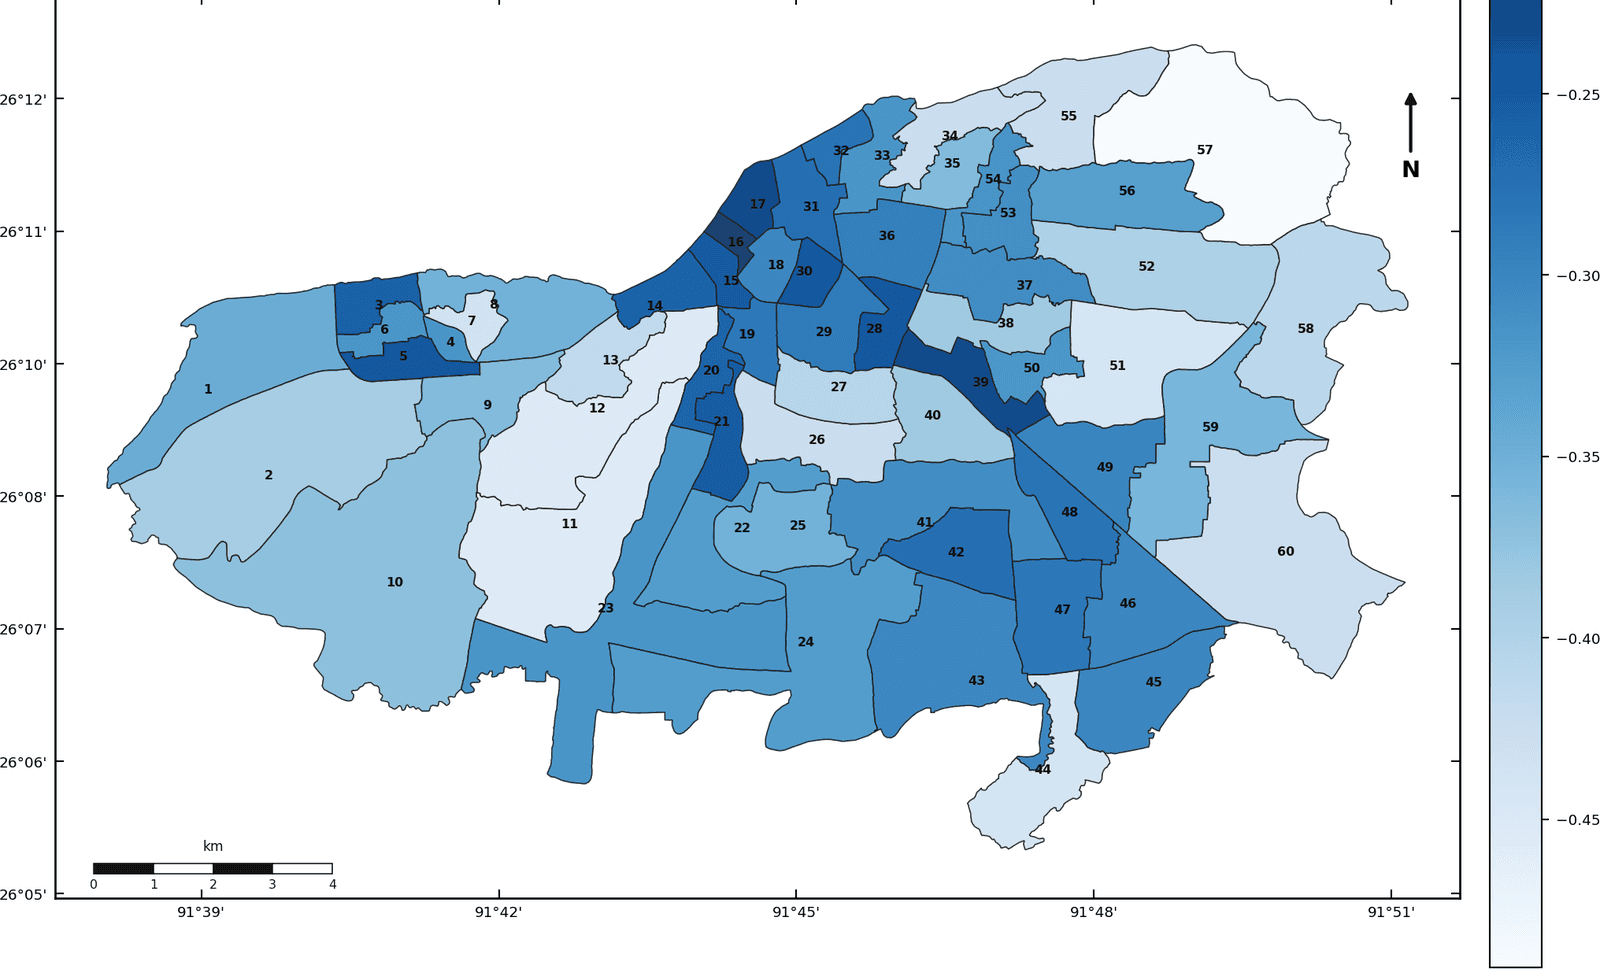
Stormwater Flushed Away
Monsoon bursts overwhelm the drainage network — stormwater is flushed away as waste instead of stored underground.
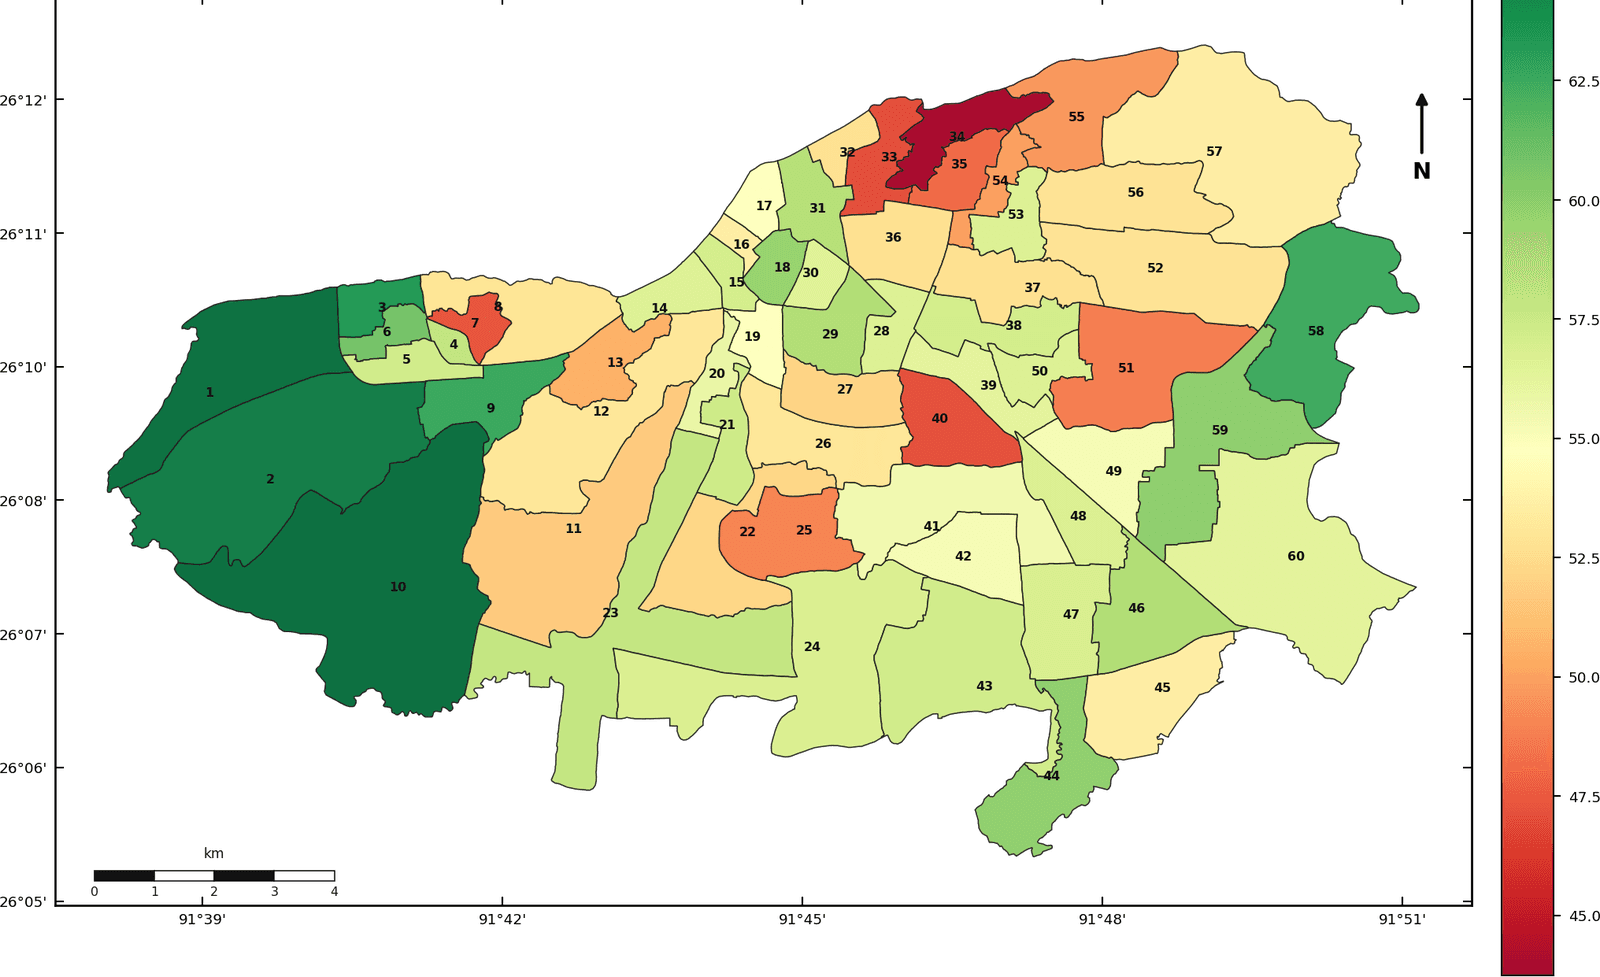
Stressed Groundwater
Groundwater stays stressed even in one of India's highest-rainfall cities.
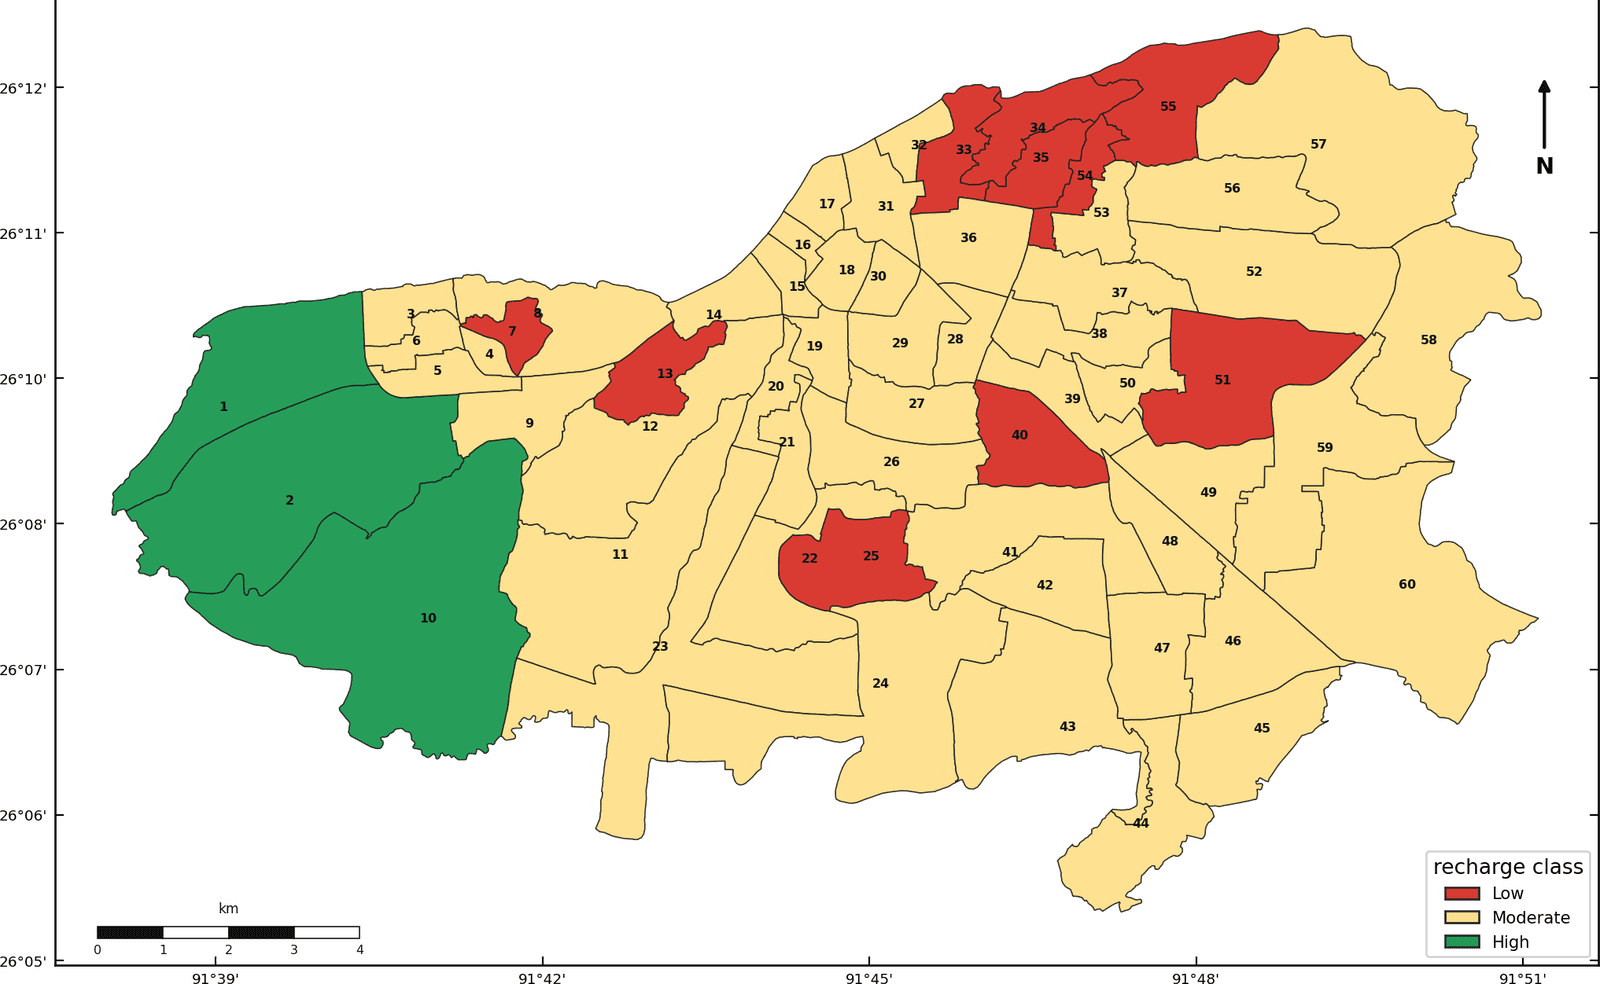
Intuition Over Evidence
Siting recharge infrastructure — pits, rain gardens, injection wells — is largely intuition, not evidence.
Unscalable Surveys
Borehole and field infiltration surveys are slow, costly, and don't scale to 60 wards.
No Decision Layer
No comparable, ward-level decision layer exists to prioritise which wards to act on first.
The Solution
Onescreeninglayer.Sixtyrankedwards,onecomparablescore.
A pre-feasibility decision layer that turns raw satellite signals into a single, comparable recharge score per ward.
Rain-Recharge Radar composites a year of open Earth-observation data — Sentinel-1 radar (SAR VV), HLS optical indices (NDVI, NDWI, NDBI), a Copernicus/SRTM elevation model, and USDA soil texture — into seven layers, then reduces them to a HydroScore for each ward. The result shows where surface conditions most favour recharge, so field effort and infrastructure spend can start with the wards most likely to pay off.
See how each layer is built→Impact
Every figure below is satellite-derived and validated in analysis — no business or ROI metrics, by design.
60 Wards · 22-Point Spread
Every GMC ward sits on one HydroScore scale, with a real 22-point range — Ward 10 (≈65.7) at the top, Ward 34 (≈43.7) at the bottom — genuinely separating favourable from unfavourable ground.
Slope Drives It · r = −0.640
Between-ward recharge favourability tracks terrain slope most strongly — flatter wards score higher, exactly as infiltration physics predicts.
Cross-Sensor Check · r = +0.807
Radar backscatter (SAR VV) agrees with the independent imperviousness layer at r = +0.807 — a physics check that the built-up signal is real structure, not noise.
Elevation Confirms It · r = −0.615
Lower-elevation wards score higher for recharge, reinforcing that the layer captures a genuine hydrological gradient rather than an artefact.
The Map · Recharge favourability
Where the ground best soaks up rain.
One combined score per ward for how well its surface lets rainwater sink in and refill groundwater. Greener wards drink the rain; redder wards shed it as runoff.
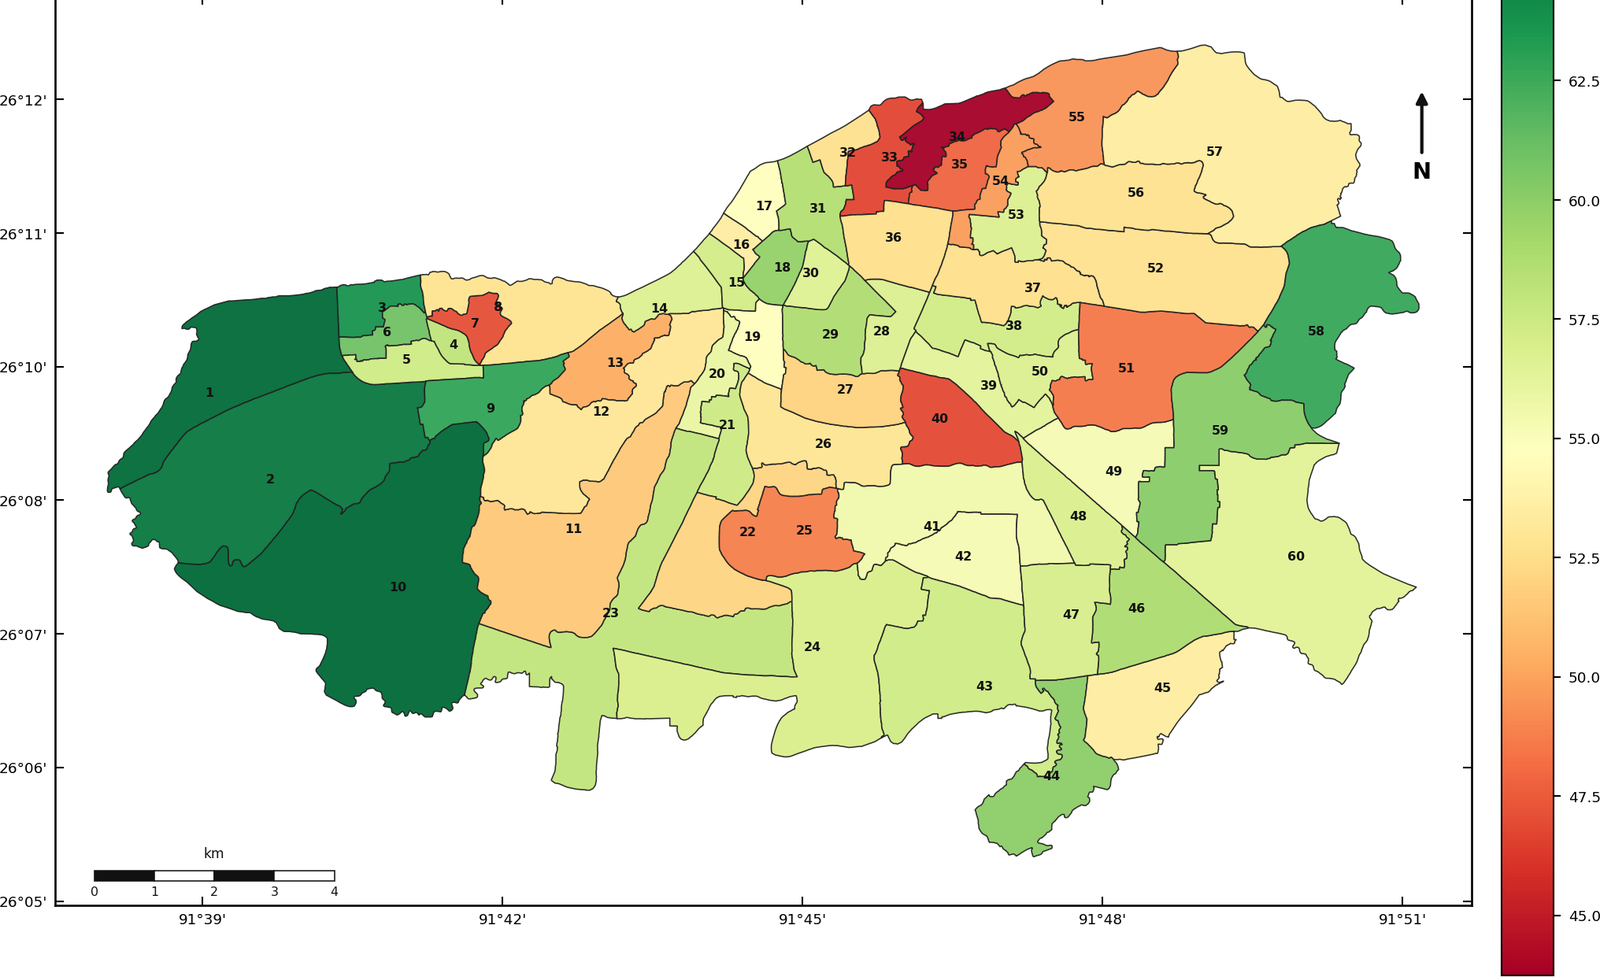
Recharge Potential Mapping — surface-condition screening, not aquifer modelling. Field infiltration validation pending.
The Layers · How the score is built
Satellite layers, one comparable score.
Each ward is measured on the same physical drivers of infiltration, then folded into a single ranked HydroScore. Every layer is read straight from open satellite data — no field survey required.
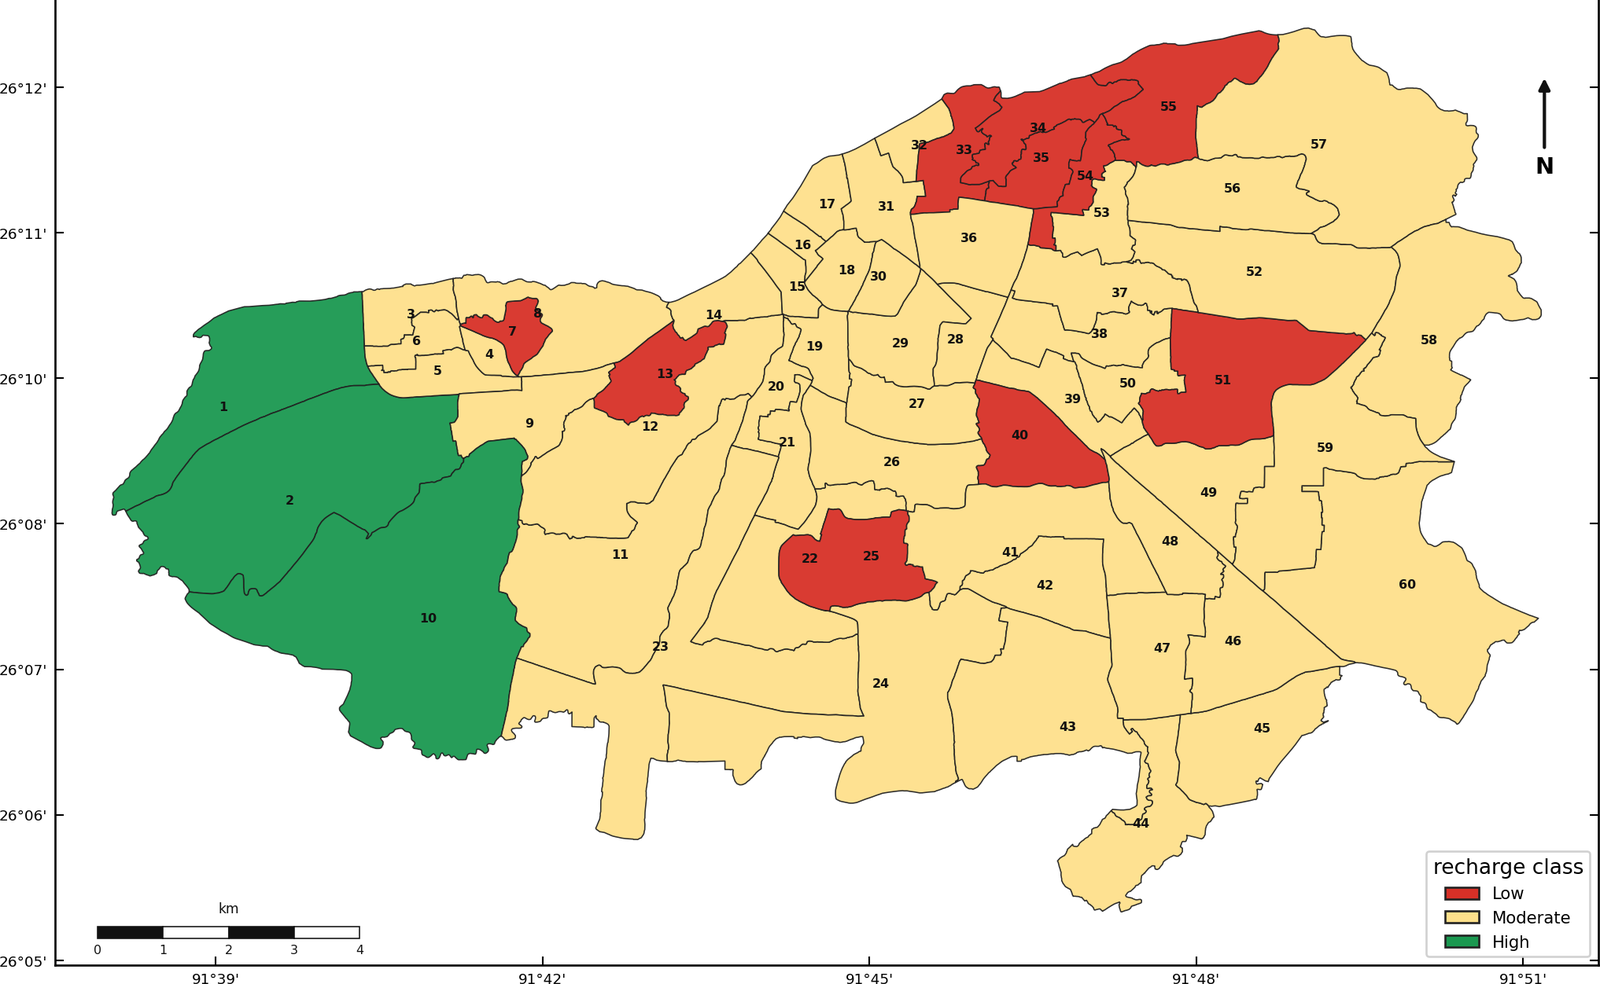
Recharge class
The three-tier verdict: low, moderate, high.
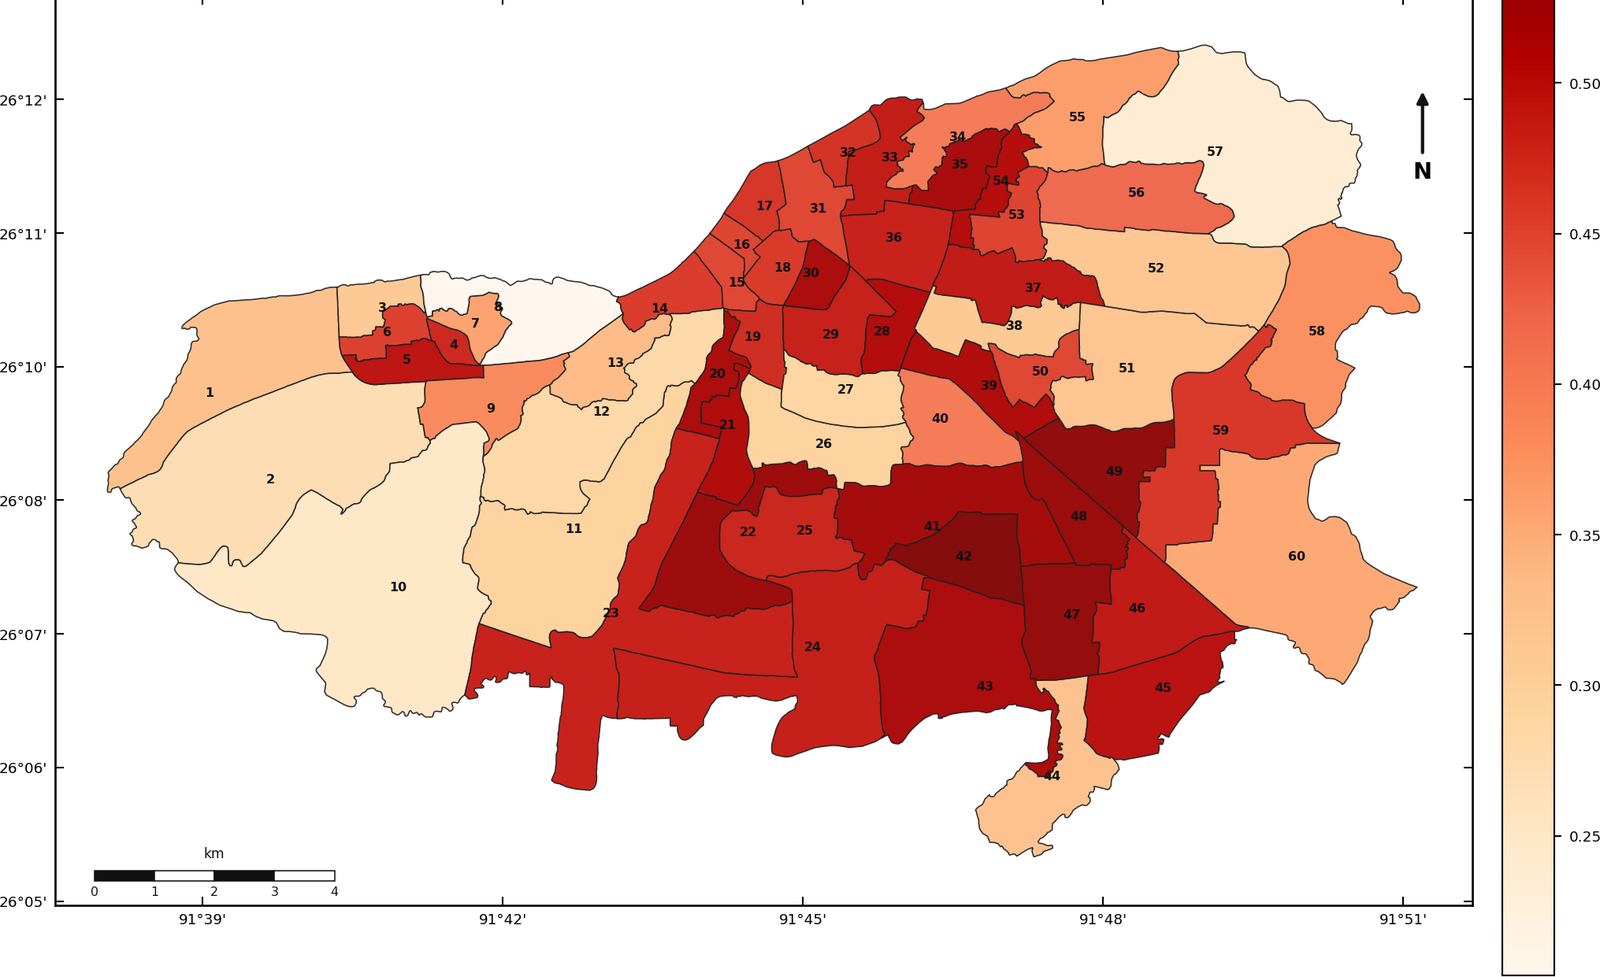
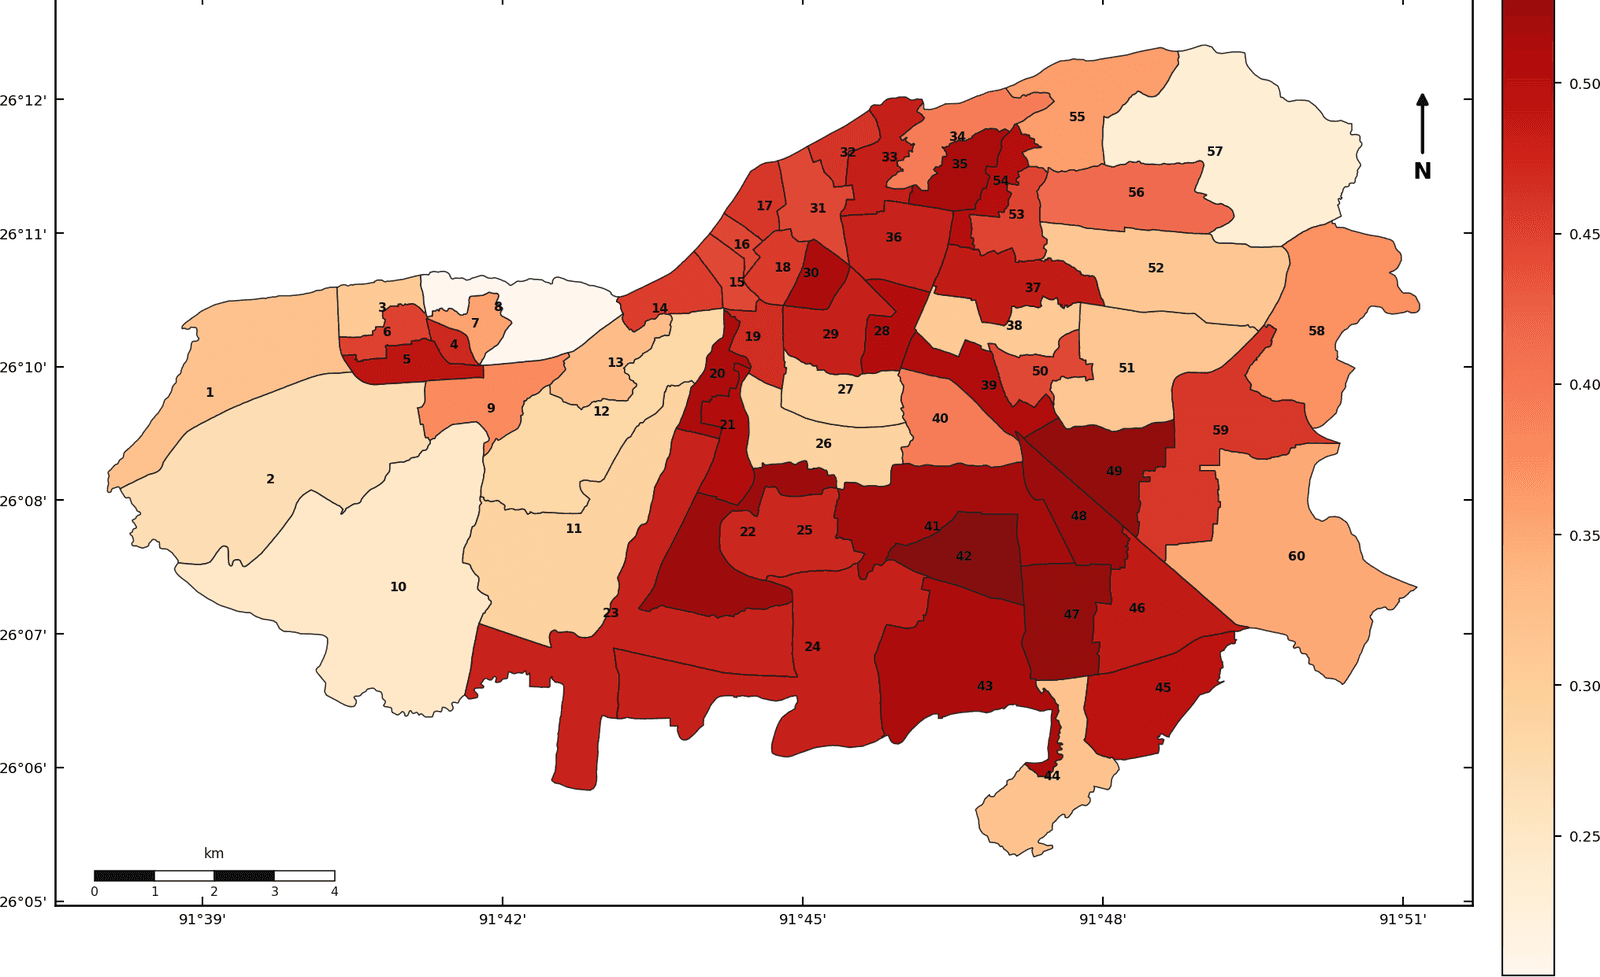
Sealed surface
Share of built + paved ground.
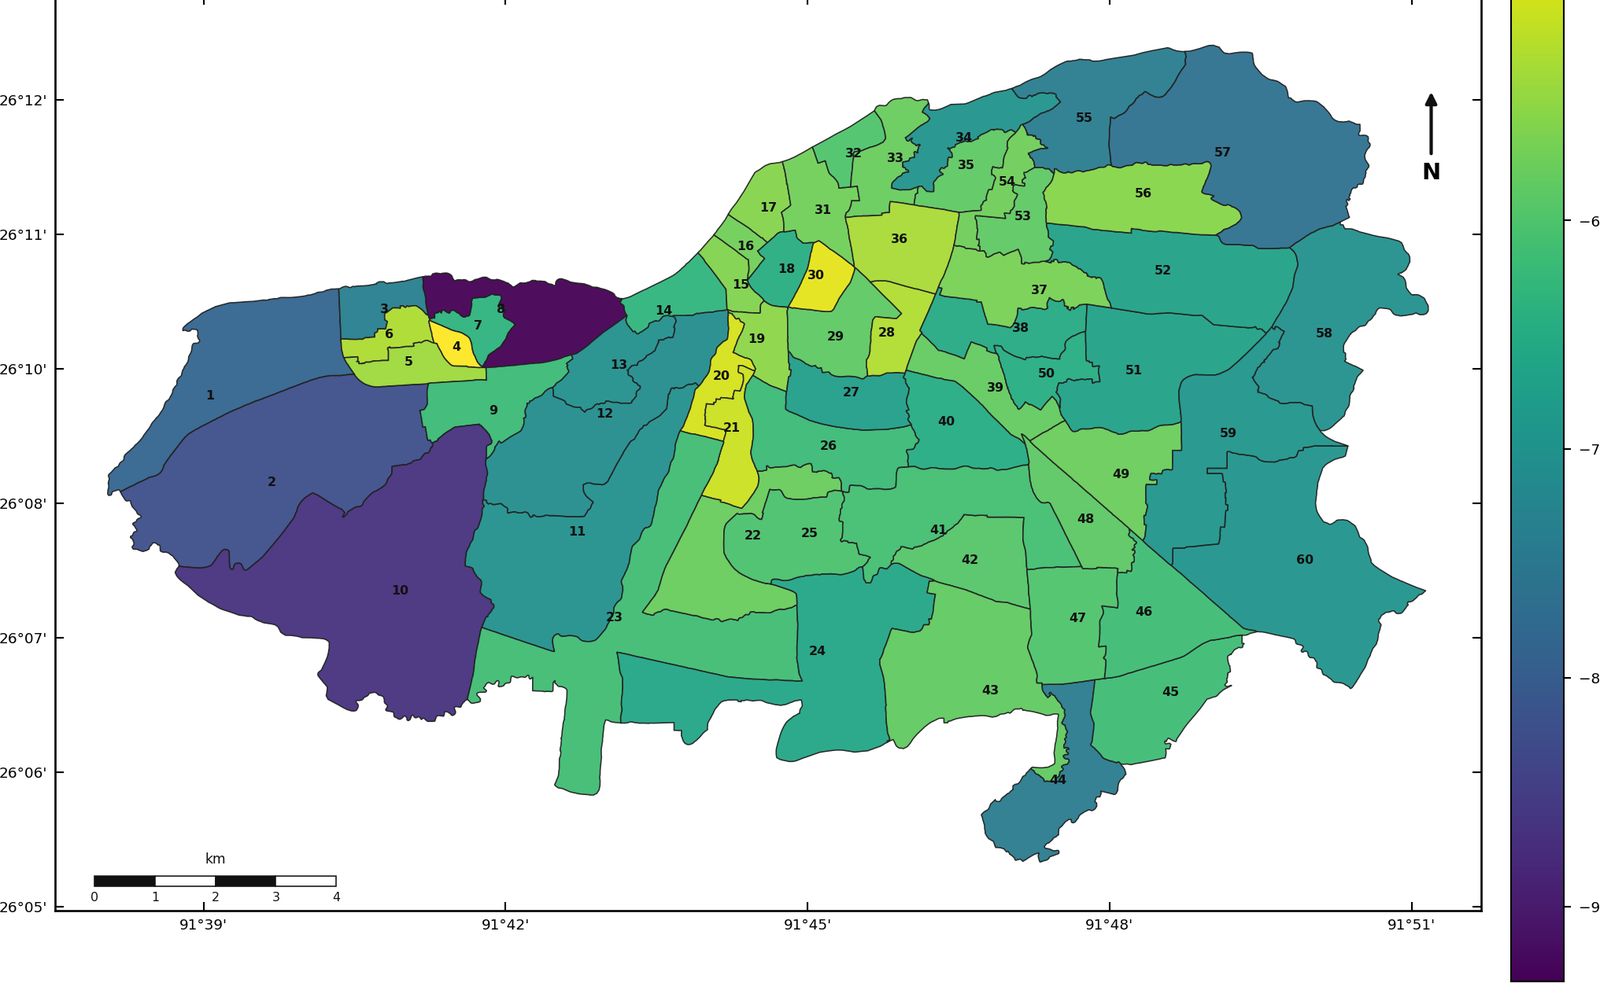
Radar roughness
Backscatter cross-checks built-up areas.
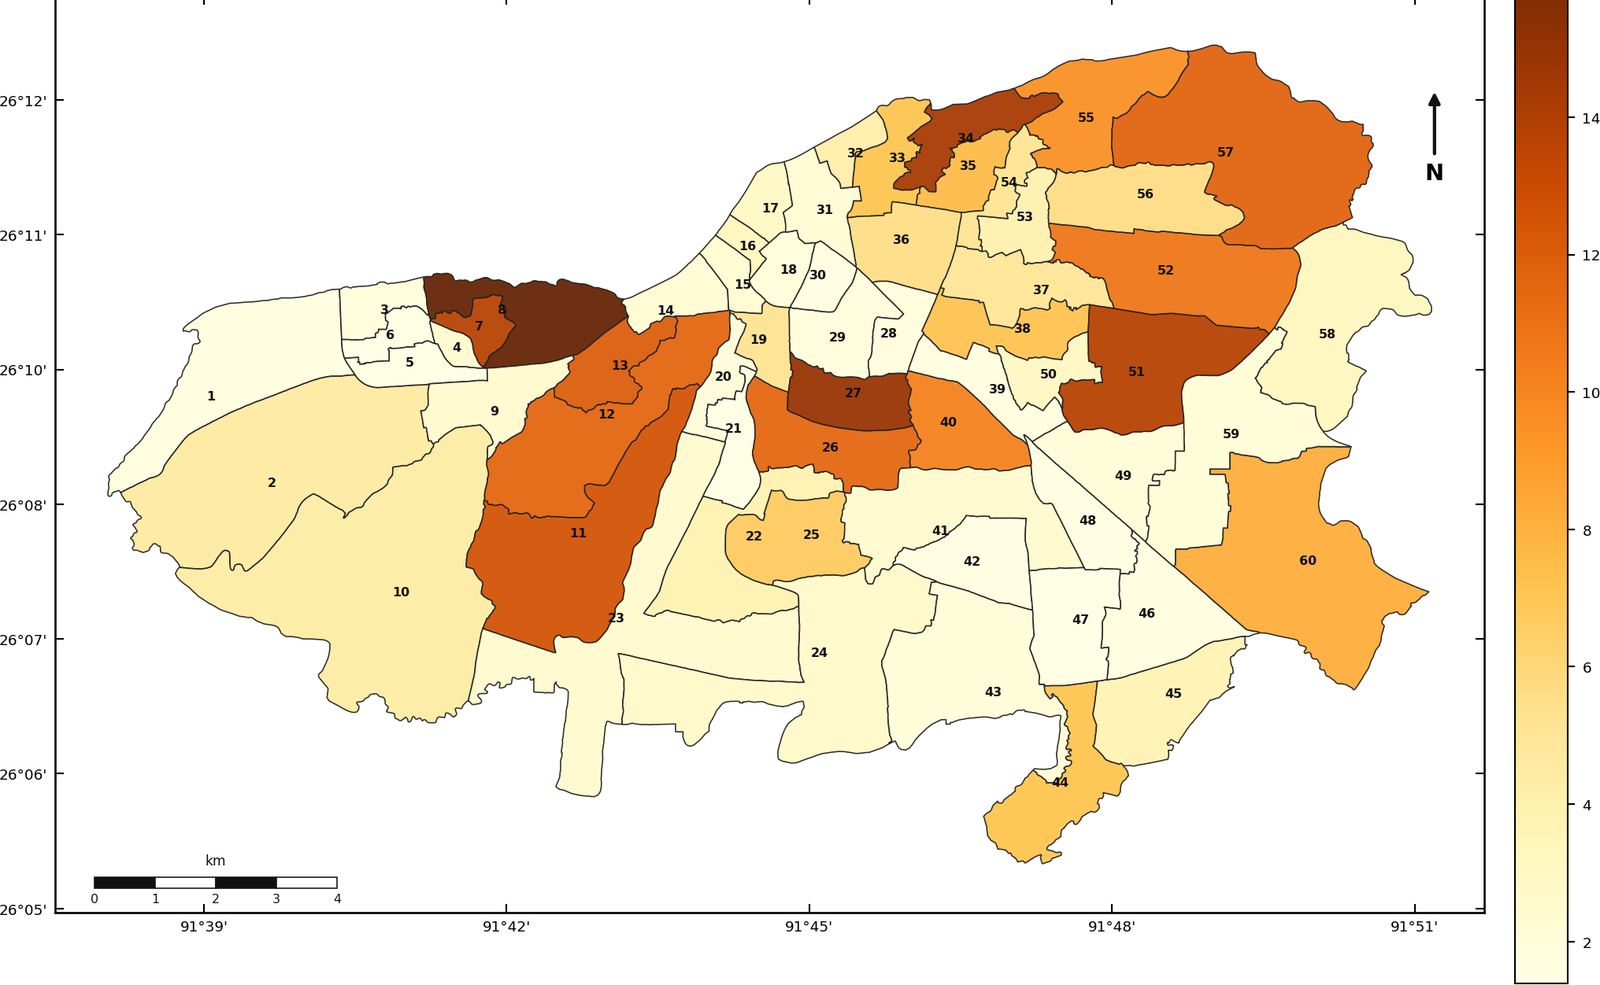
Slope
Steeper land sheds more water.
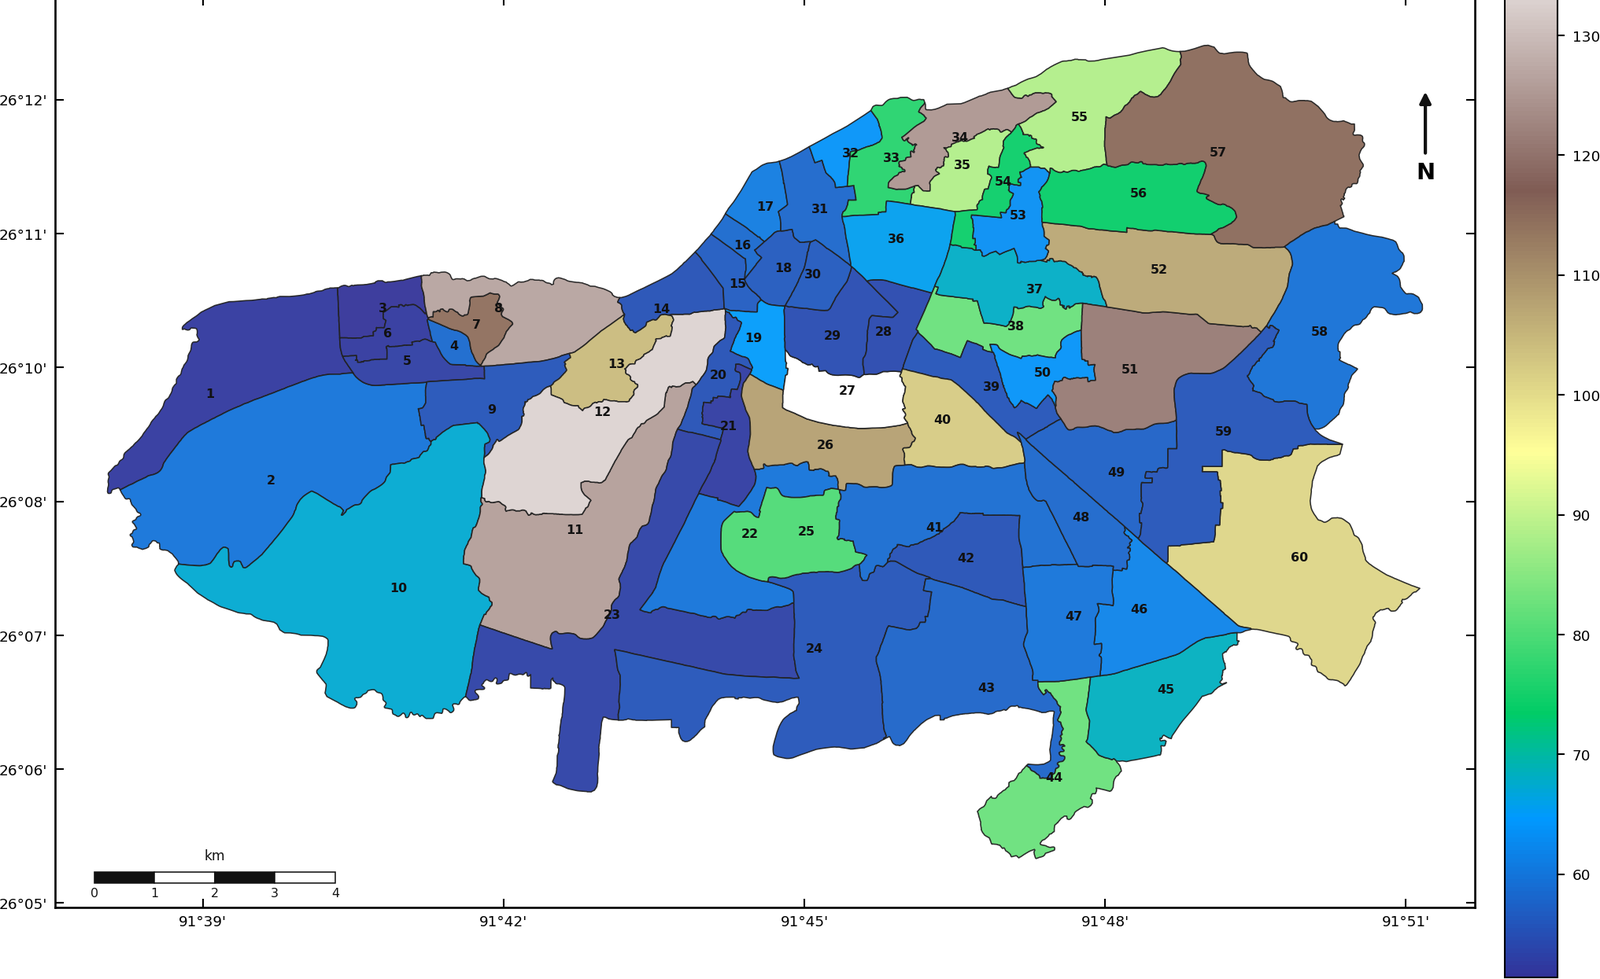
Elevation
Mean ground height per ward.
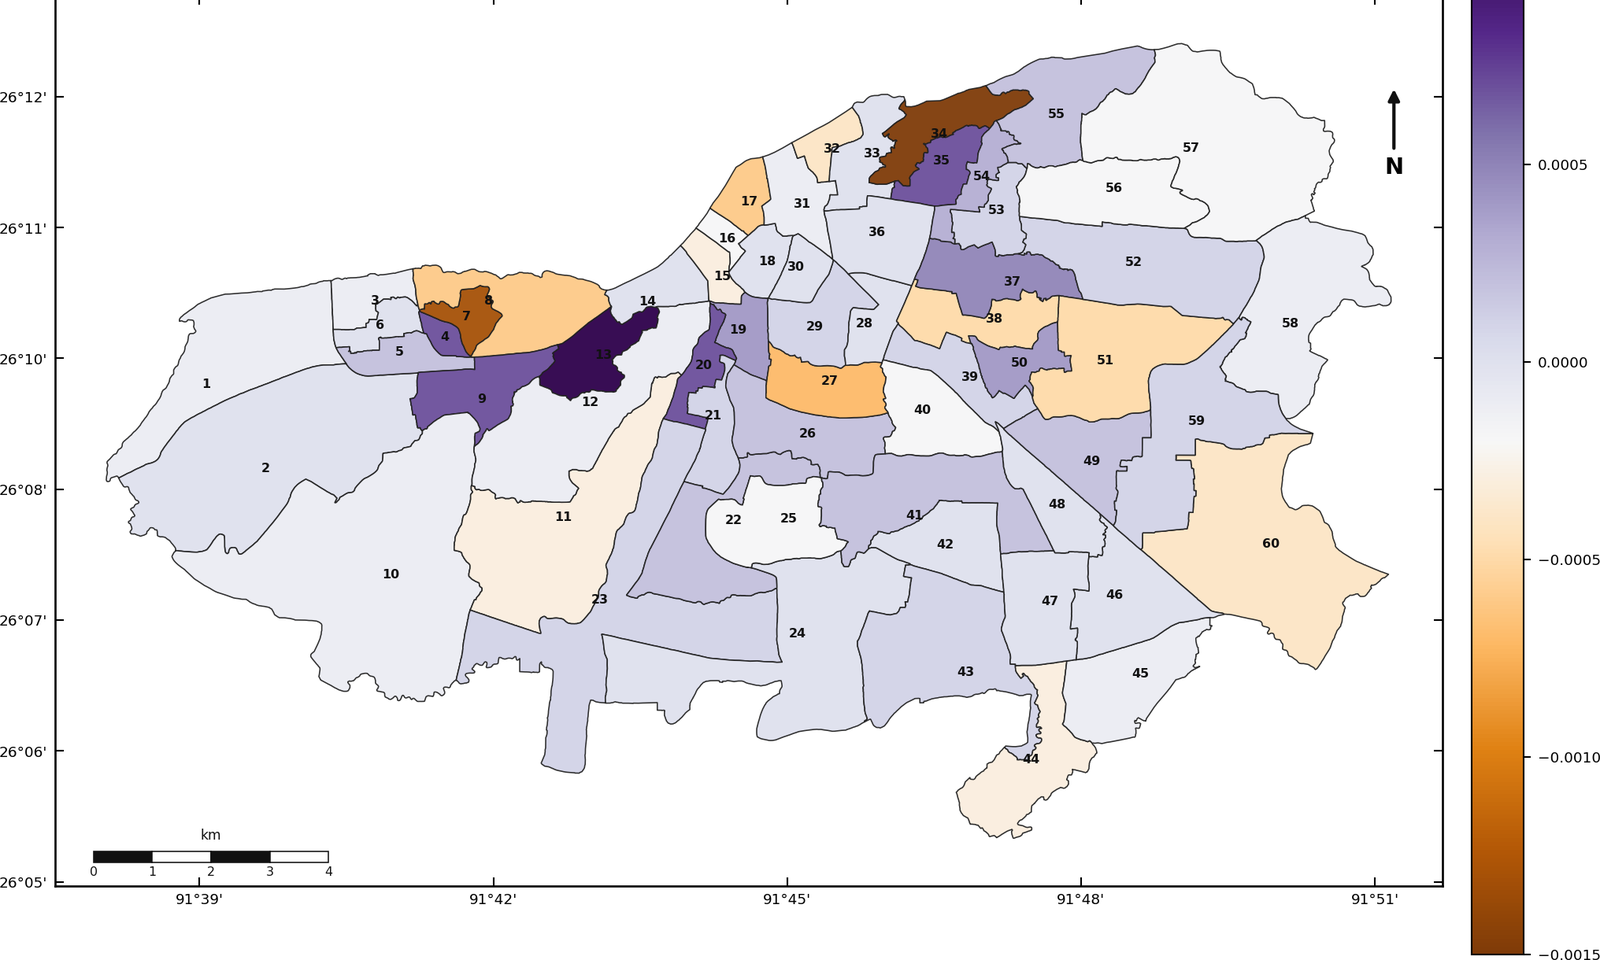
Concavity
Hollows collect water; ridges shed it.
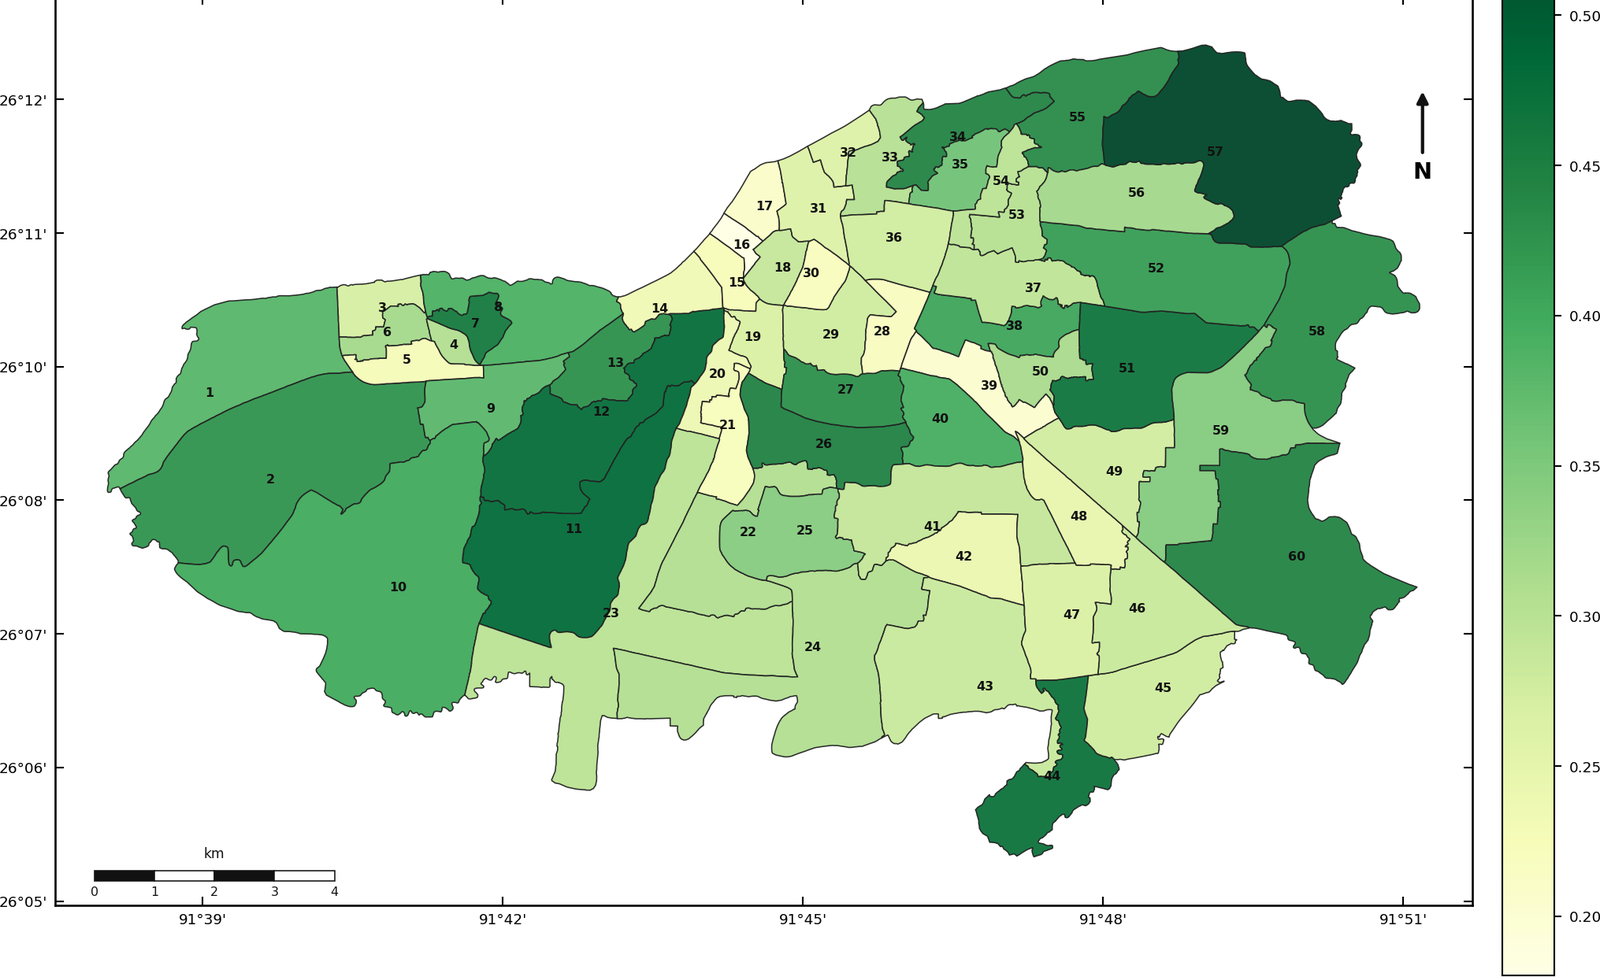
Vegetation
Greener ground is more permeable.
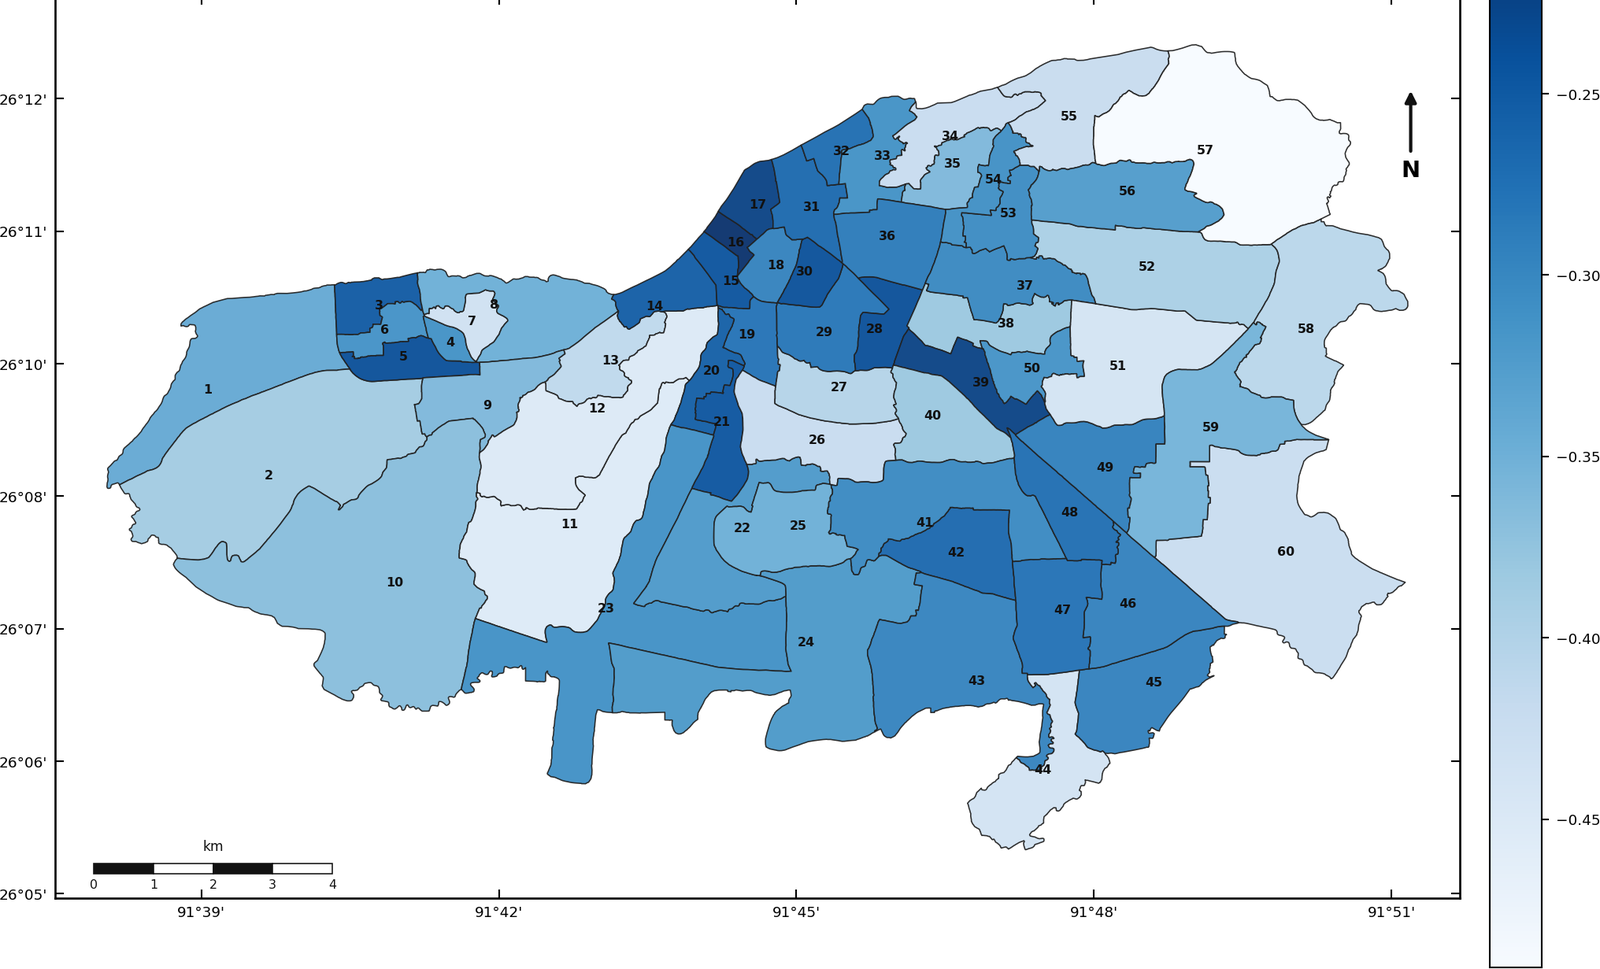
Surface moisture
Standing water and wet zones.
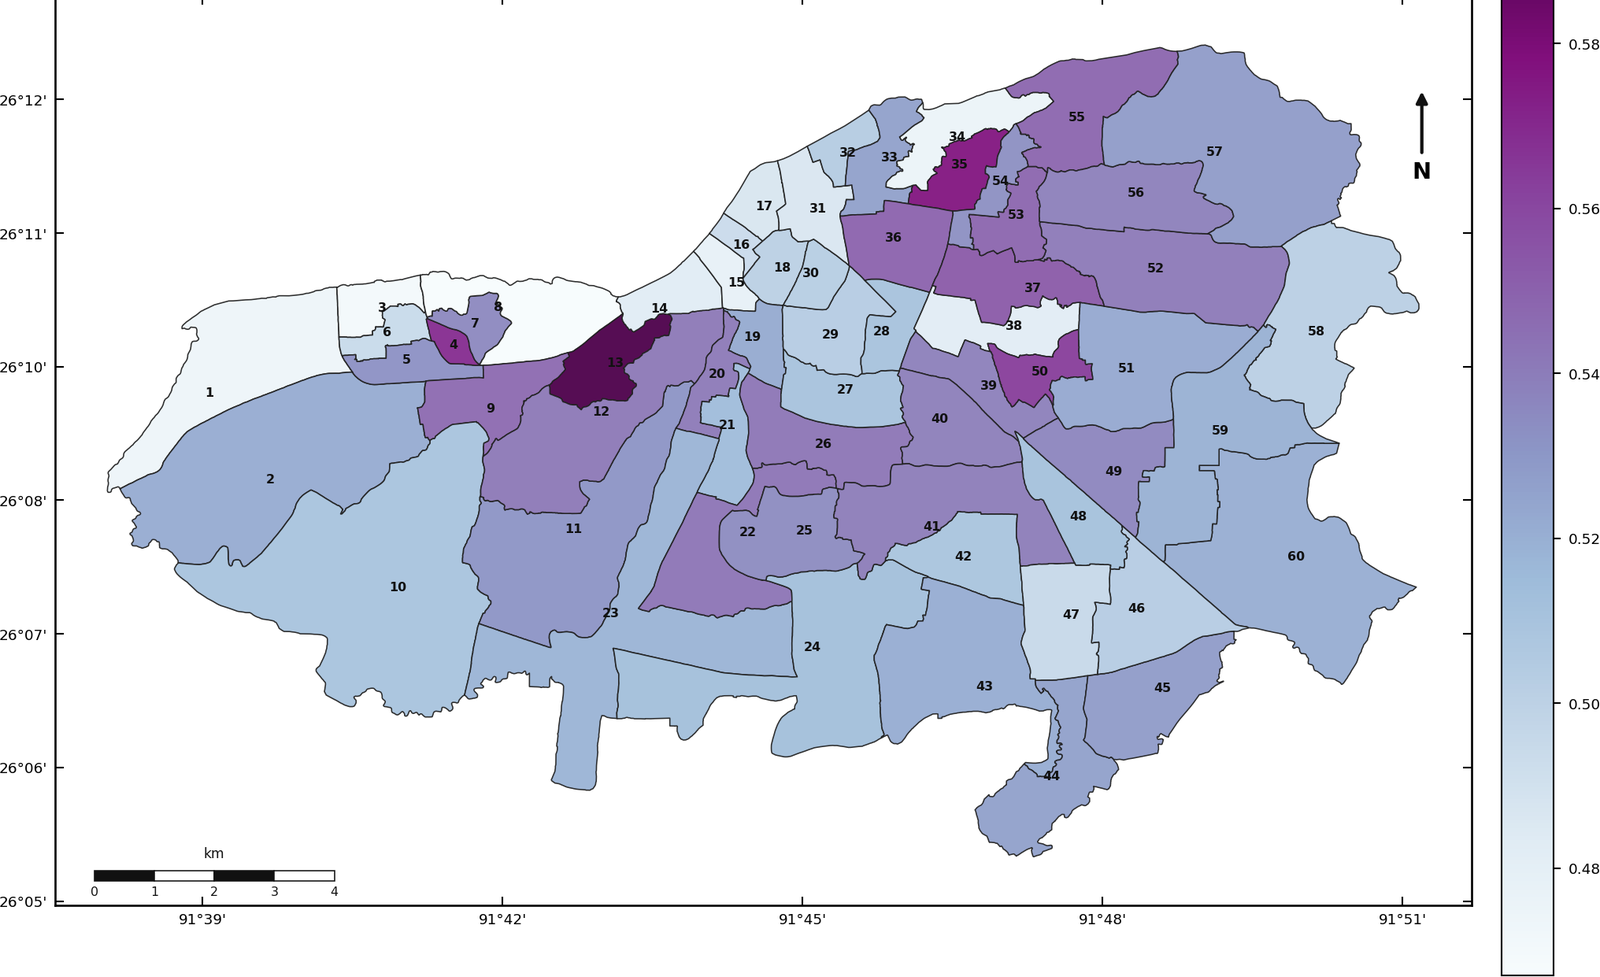
Water-collecting area
Share of ward that is hollow terrain.
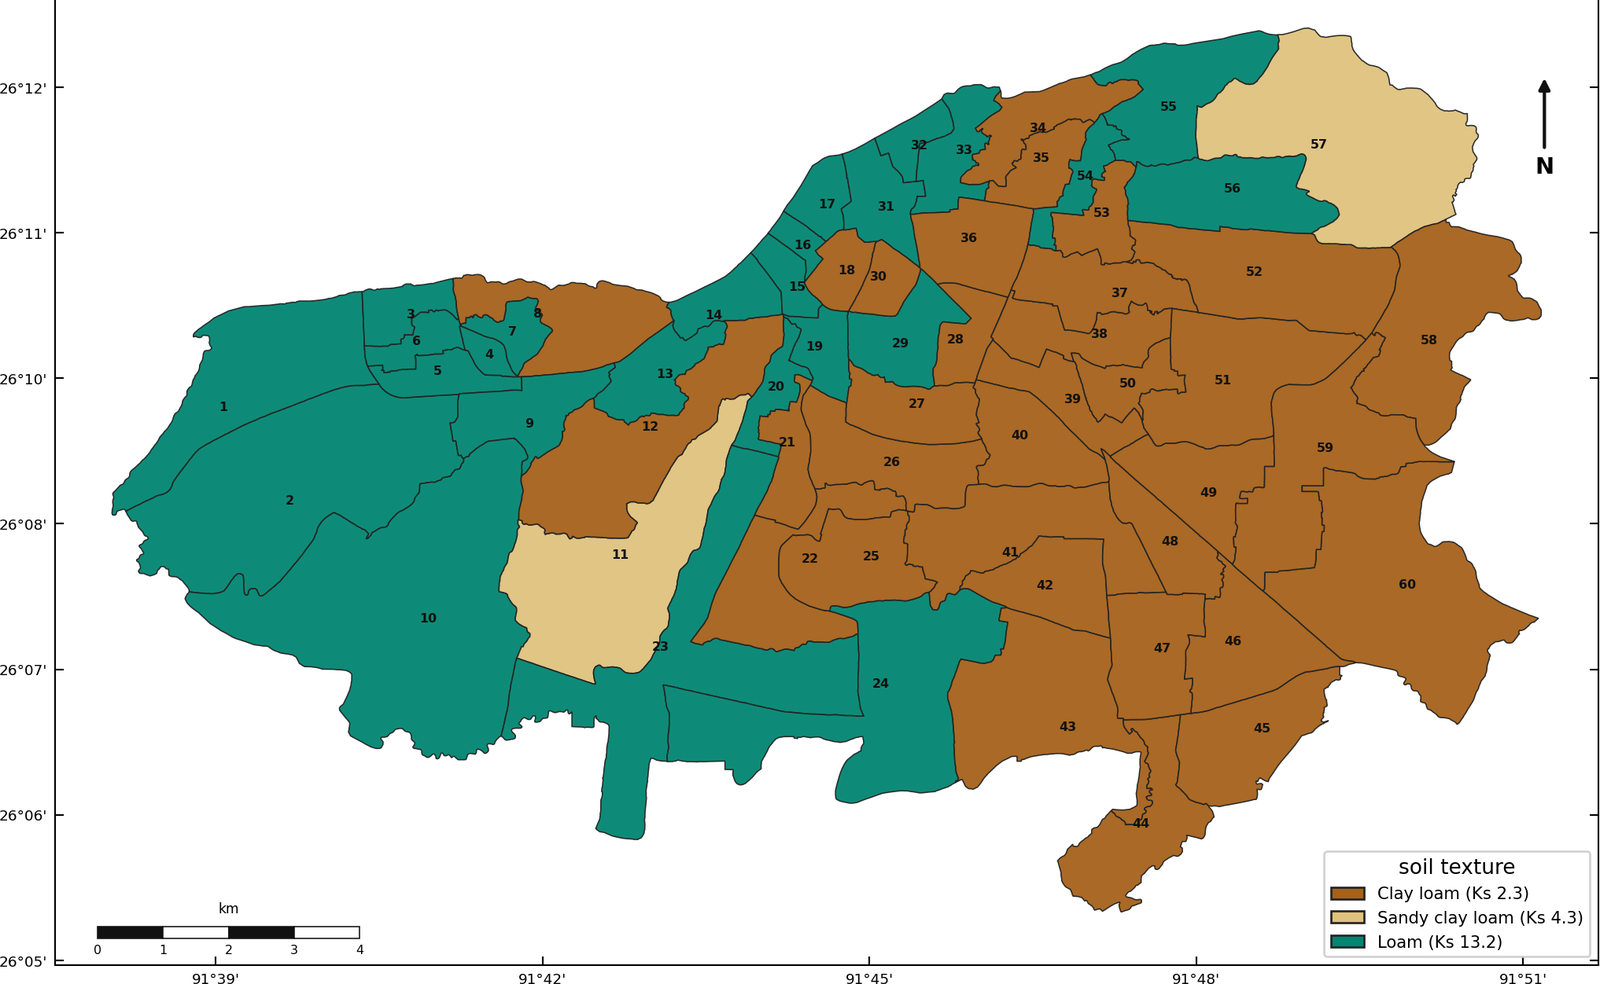
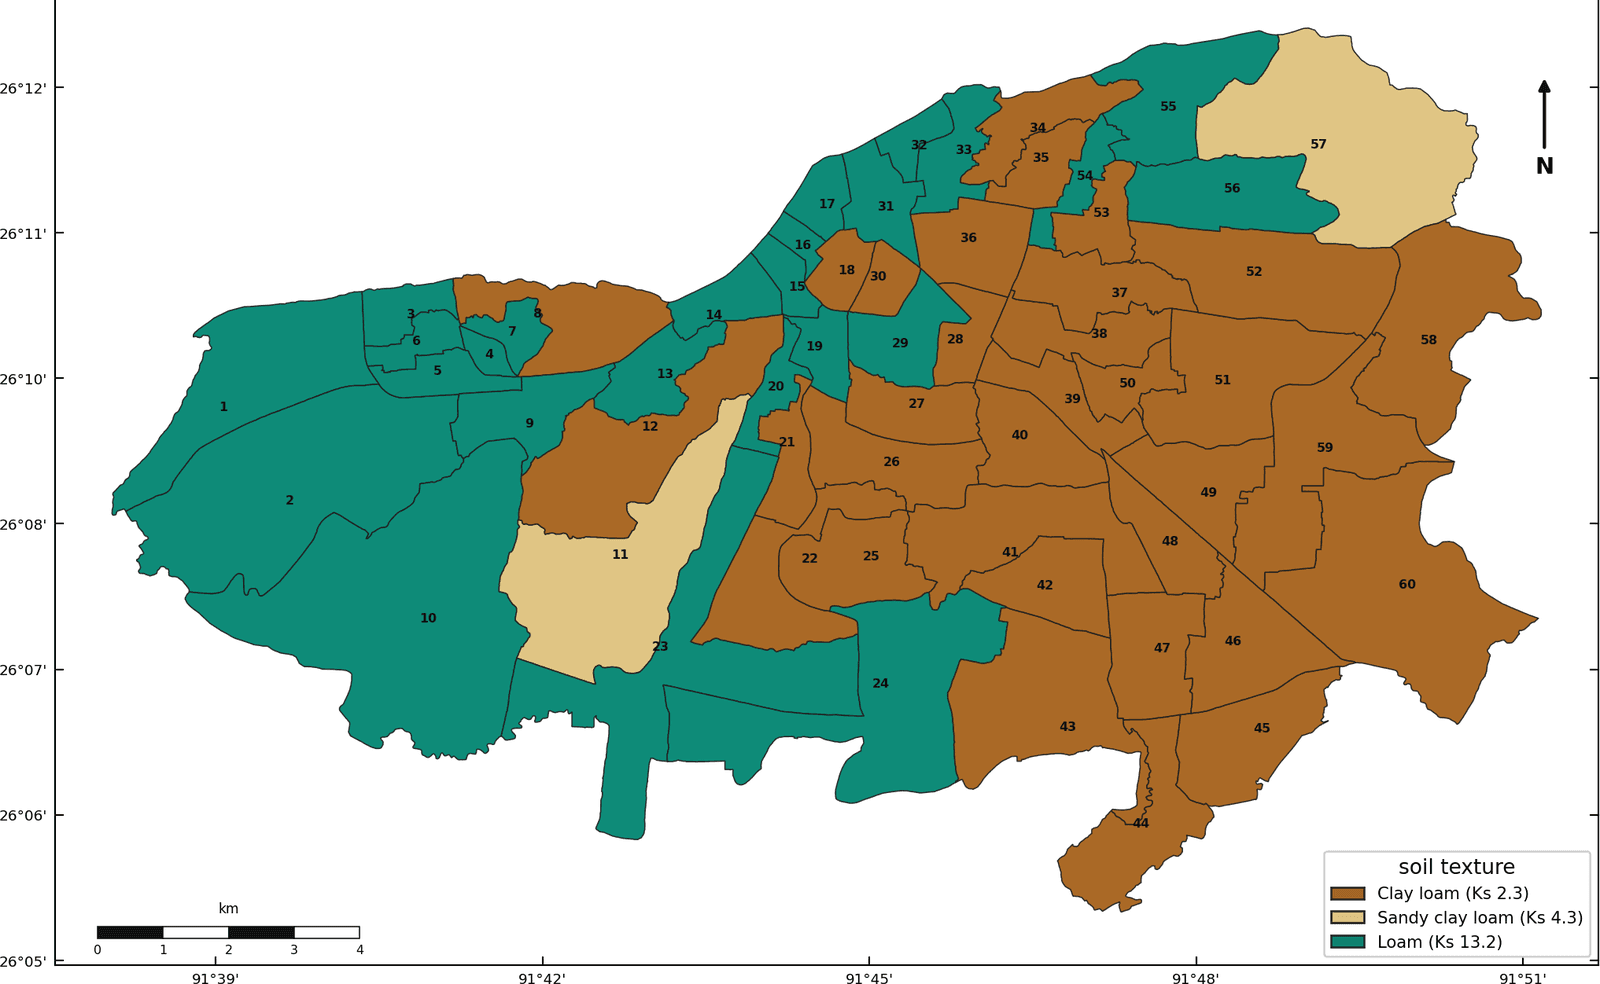
Soil infiltration
How fast water seeps through.
Validation
What the numbers do — and don't — claim
Stormwater isn't waste to flush away — it's storage waiting for the right ground. Rain-Recharge Radar shows planners where that ground is.
Project rationale
Rain-Recharge Radar · Tier-0 screening layer
Rain-Recharge Radar
Surface-condition screening
Every figure on this page is satellite-derived and validated in analysis — the 22-point HydroScore spread and the slope, imperviousness, and elevation correlations. Field infiltration checks at the top-scoring wards are the stated next step, framed as roadmap, not a claim already made.
Satellite-verified · field checks next